Viewing traces
Open the Polos dashboard at http://localhost:5173 to view execution traces. Each agent or workflow run is recorded with full detail.Timeline view
The timeline view shows every step of your agent’s execution in chronological order, including LLM calls, tool invocations, and their inputs/outputs: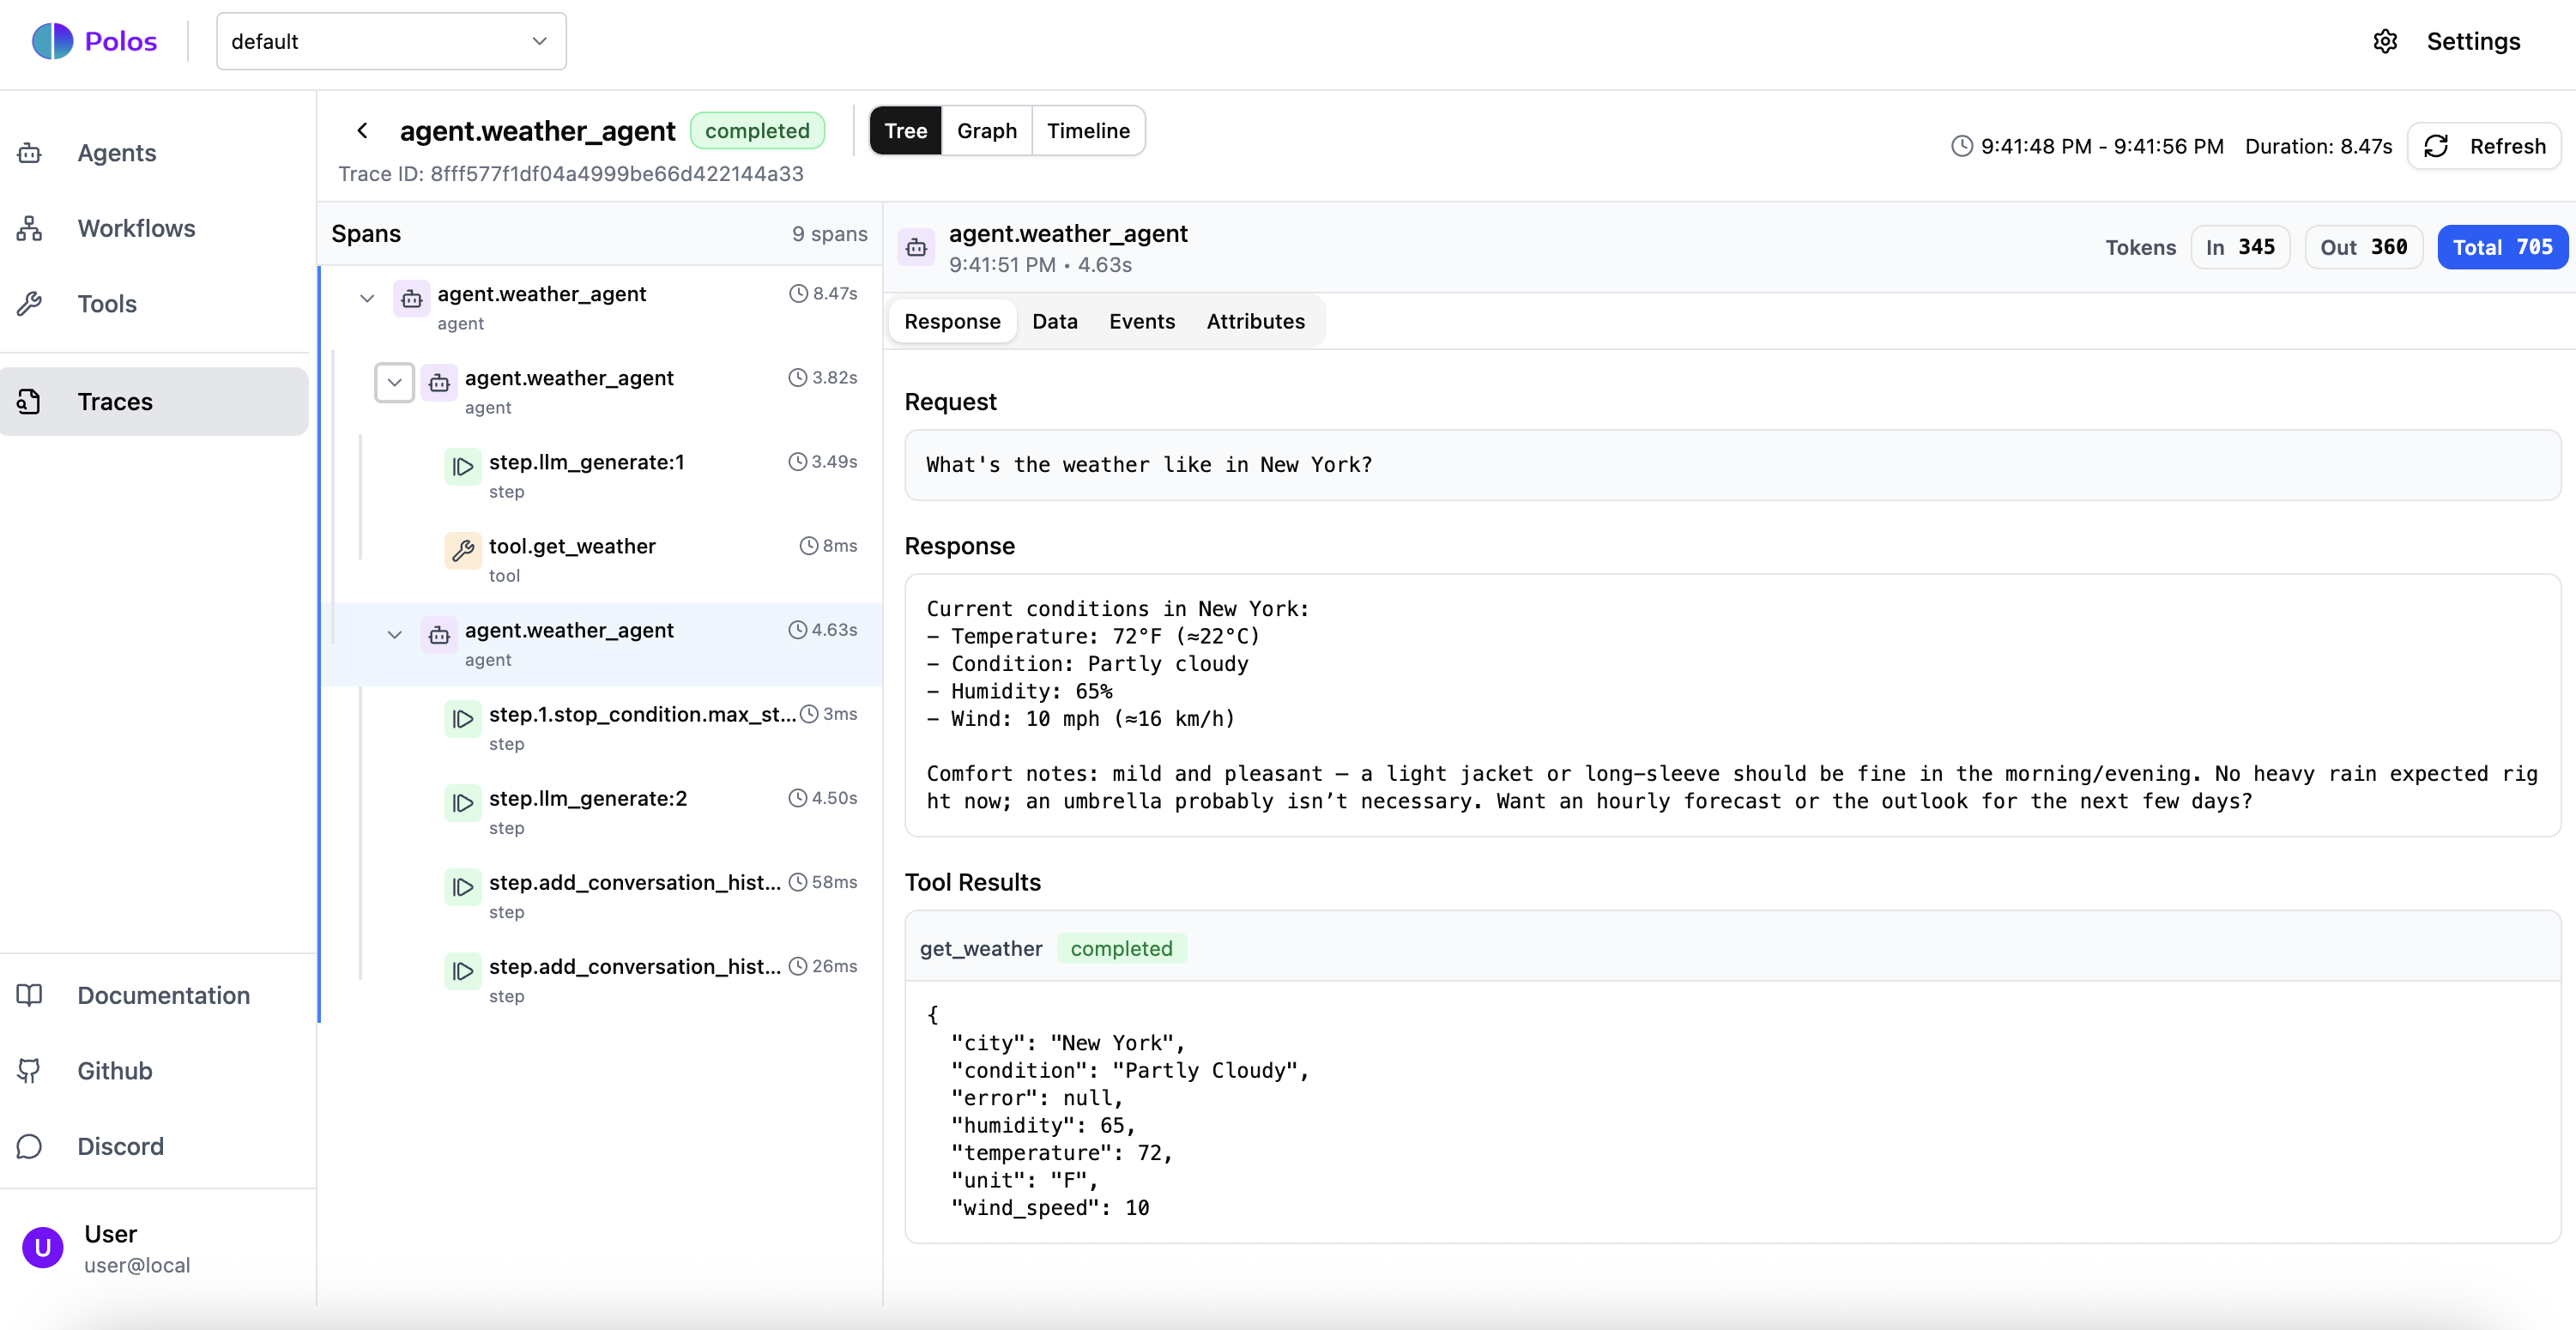
Graph view
The graph view visualizes the execution flow, making it easy to see how steps relate to each other and understand the structure of complex workflows: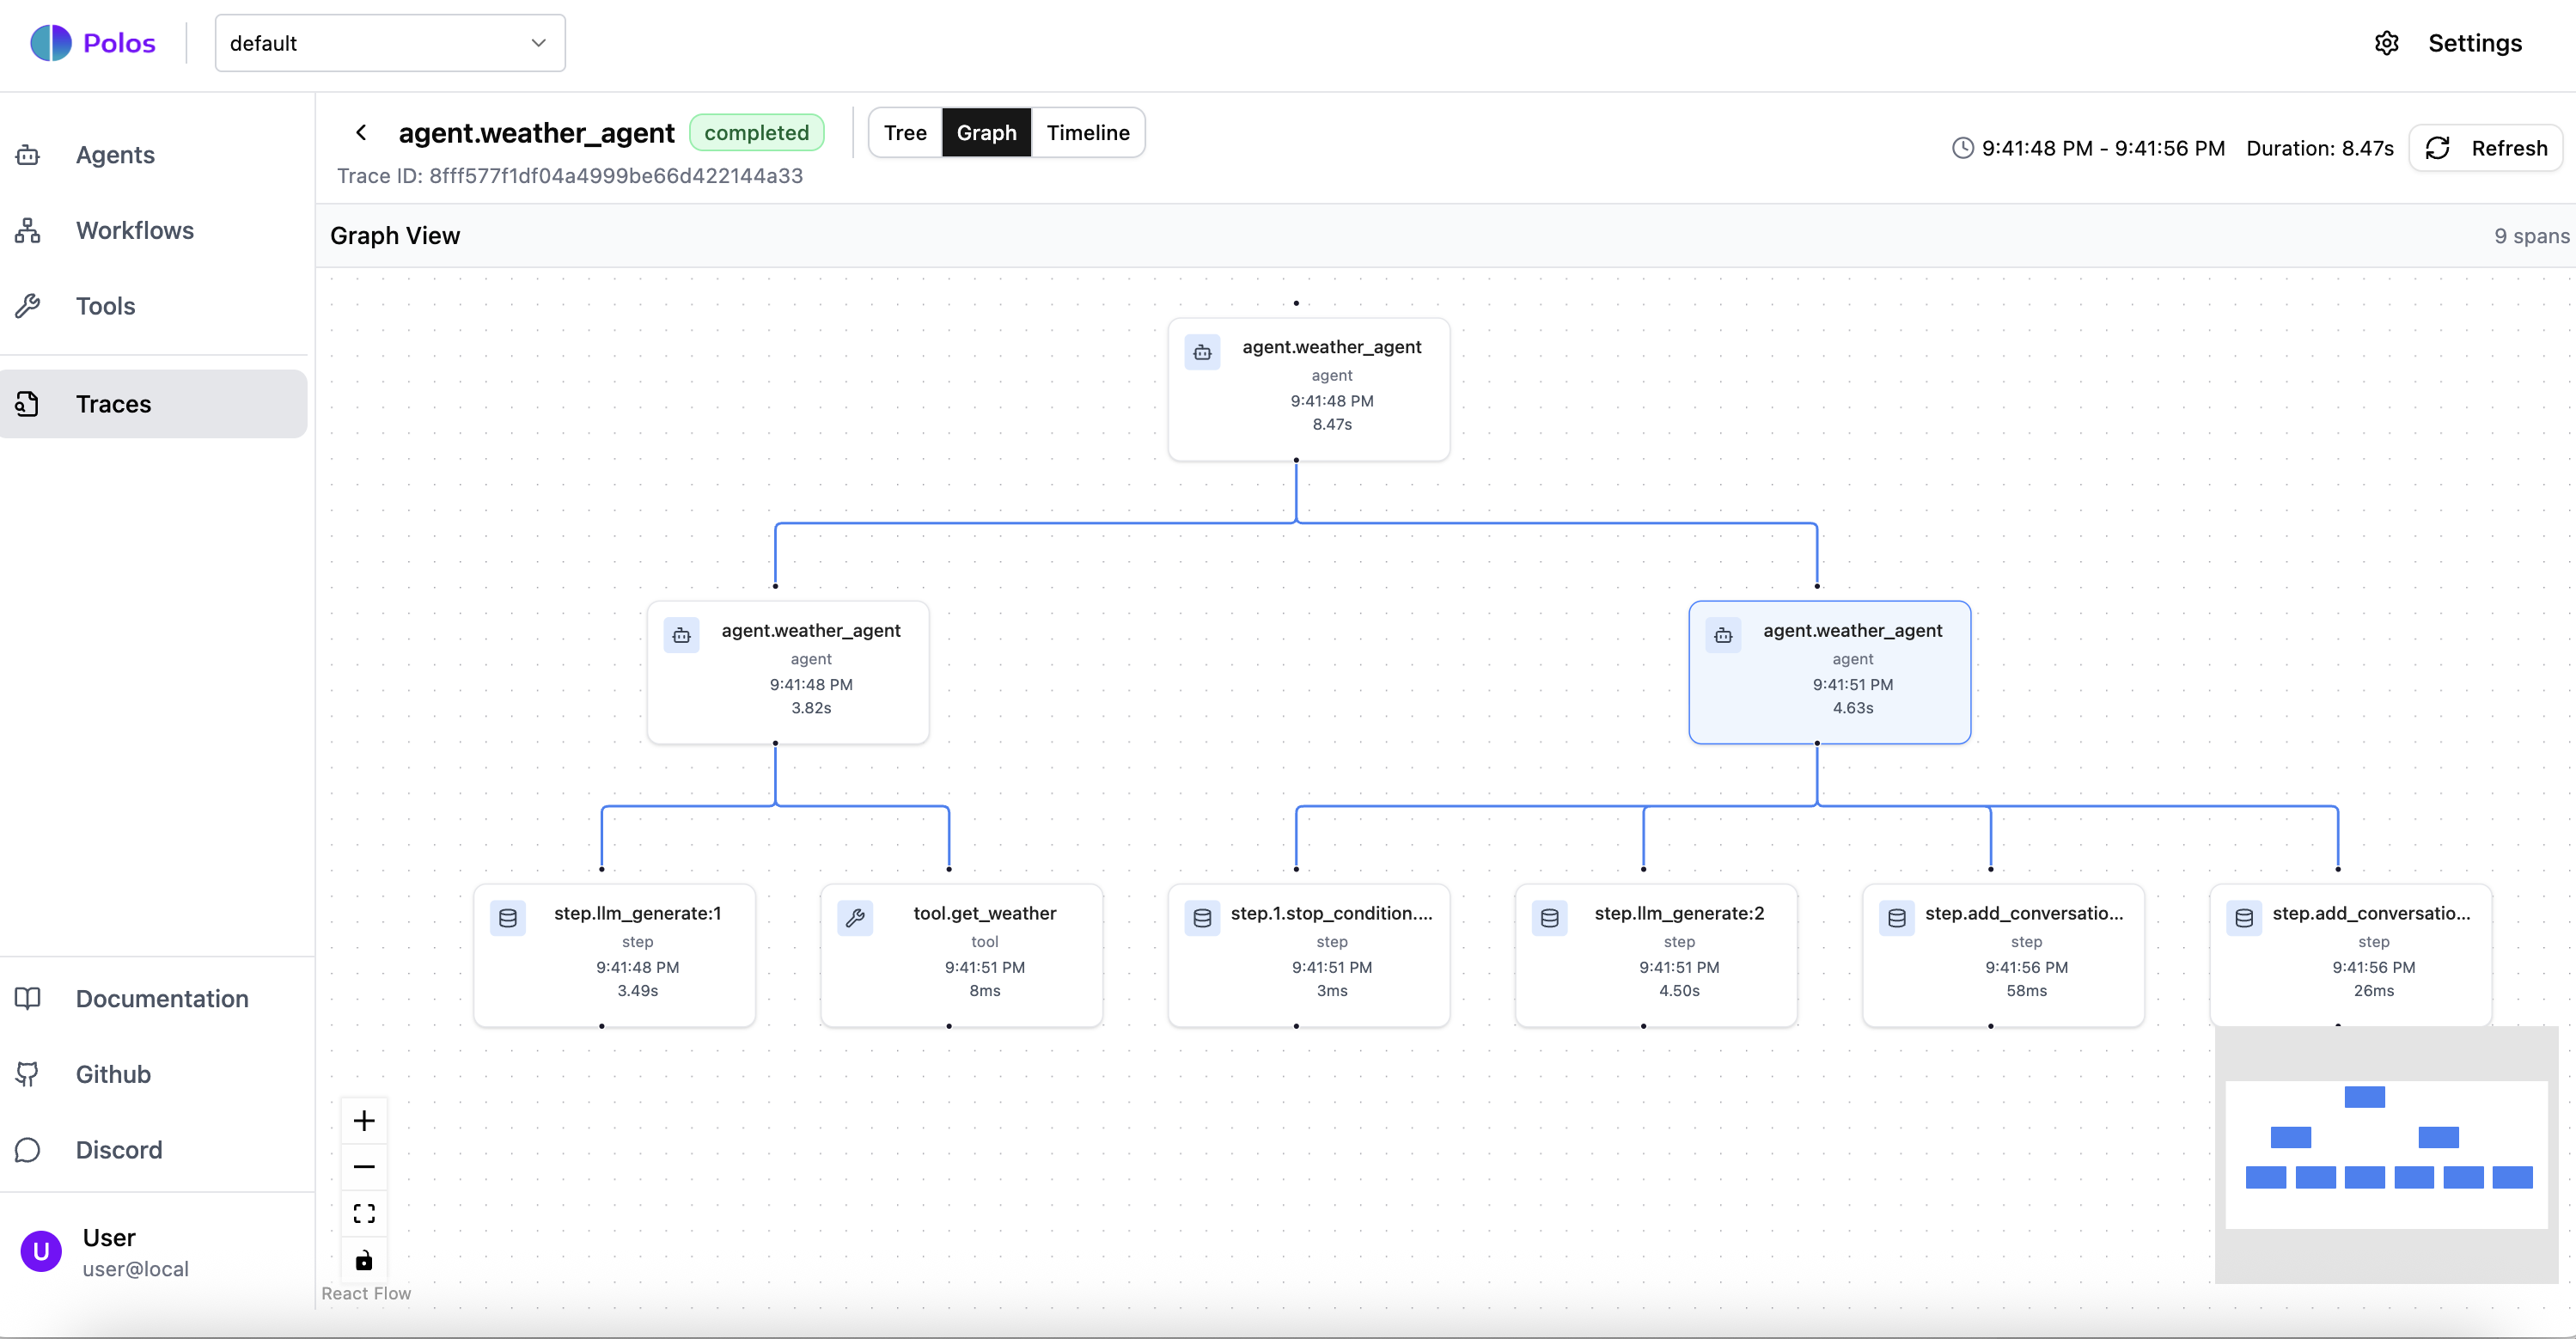
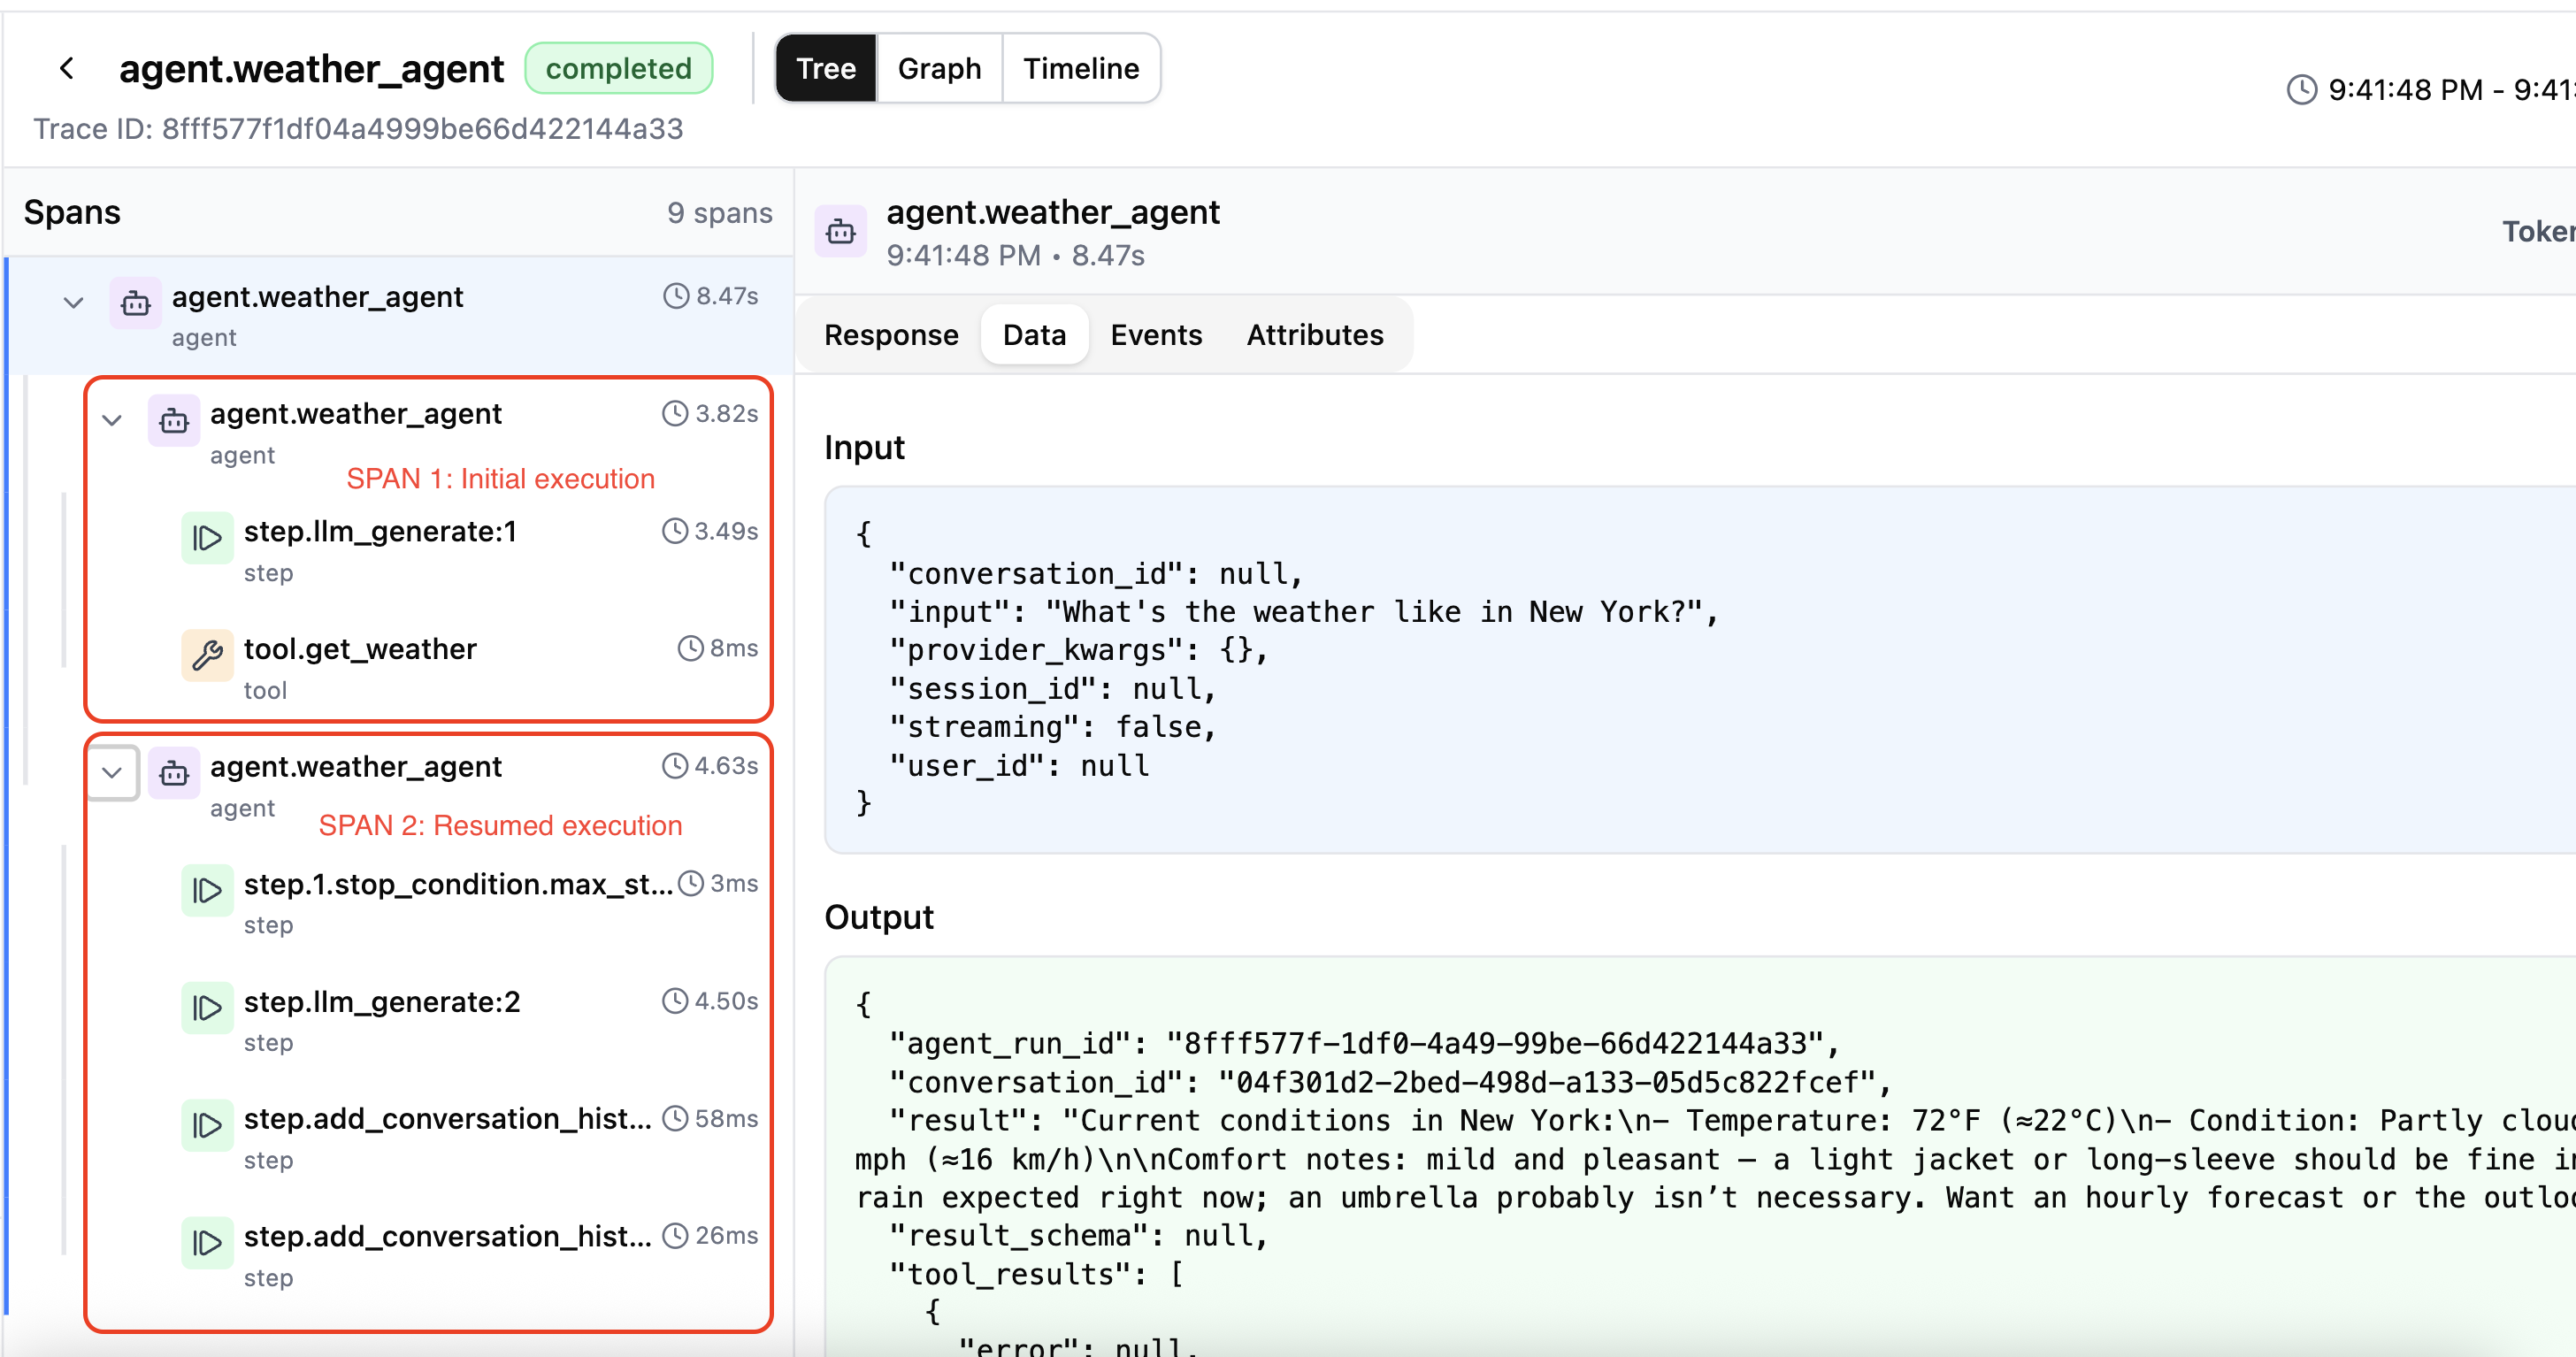
Understanding spans
Polos organizes traces into spans that represent units of active execution. A key concept is that spans end when an agent or workflow enters a waiting state - this reflects how Polos manages resources efficiently.Example: Weather agent execution
Consider a weather agent that:- Starts execution
- Calls the LLM
- LLM decides to call the
get_weathertool - Agent enters waiting state while tool executes
- Resumes after tool completes
- Calls LLM again with the tool result
- Returns final response
- Agent starts
- Calls LLM
- LLM requests tool call
- Agent enters waiting state (span ends)
- Agent resumes after tool completes
- Calls LLM with tool result
- Agent returns final response (span ends)
What gets traced
Polos automatically captures:- LLM calls: Model, prompt, response, token usage, latency
- Tool invocations: Tool name, inputs, outputs, duration
- State transitions: When agents pause, resume, or complete
- Workflow steps: Each step in a workflow with its result
- Errors: Full error details and stack traces when failures occur